Monte Carlo
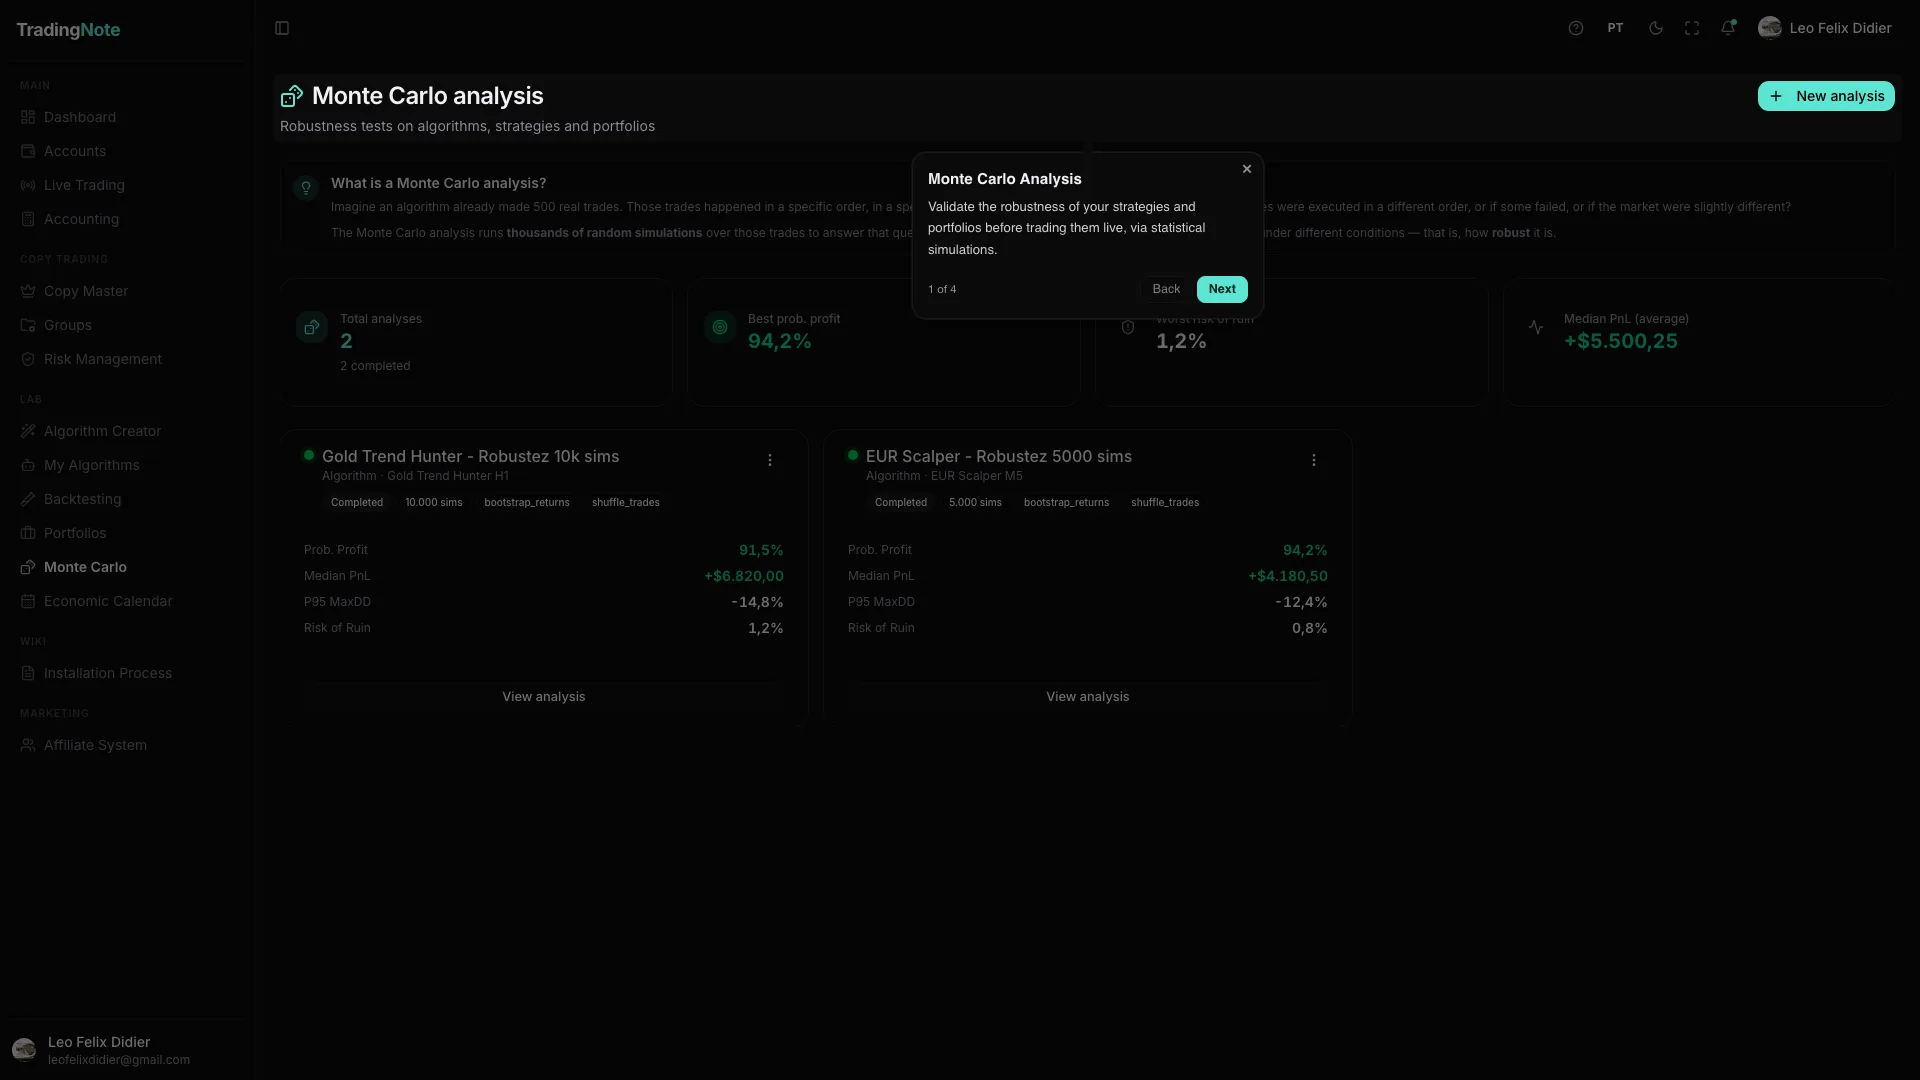
Stress-tests a system's soundness by simulating thousands of possible scenarios, not just the one that happened. It answers: «was I lucky or is my system real?».
Monte Carlo analysis answers the most uncomfortable question in trading: «was I lucky, or is my system genuinely solid?». Your backtest shows you ONE story: the one that actually happened. But that exact sequence of wins and losses will never repeat. Monte Carlo takes your trades and reshuffles and varies them thousands of times to build thousands of equally plausible alternative histories. So you stop seeing a single result and start seeing the range of results that could have happened — which is what will actually happen to you live.
What it does under the hood
The simulation doesn't invent trades out of thin air: it starts from YOUR real trades (from the backtest) and perturbs them in statistically valid ways. These are the three main techniques:
| Technique | What it changes | What question it answers |
|---|---|---|
| Reshuffle | The order your trades occur in, not which ones. | What if the bad streak had come first? Would you have survived? |
| Resample (bootstrap) | Draws trades at random with replacement to form new histories. | How dependent is the result on a few lucky trades? |
| Skip trades | Removes a random % of trades (the ones you missed being offline, slippage, etc.). | Does the system hold if in practice you don't take every signal? |
How to read the result: percentiles
Monte Carlo doesn't give you a number, it gives you a distribution. The key is in the percentiles: the 5th percentile is the «bad scenario» (only 1 in 20 histories came out worse) and the 95th is the «good scenario». What matters is not the average, but how bad the realistic worst case is.
| Metric | How to interpret it |
|---|---|
| Drawdown at the 95th percentile | The realistic worst drawdown. If your risk plan can't take that drop, the system will knock you out before it works. |
| % of profitable scenarios | If only 60% of histories ended green, your profitability depends too much on luck. |
| Return range (p5 – p95) | A narrow range = consistent system. A huge range = the result is almost a lottery. |
Don't just look at the average scenario. Focus on the worst 5%: if your system is still profitable (or at least doesn't blow up) there, you're ready for the reality of the market. Most traders blow up precisely because they planned for the average and lived the 5th percentile.
Monte Carlo vs Multiverse: not the same thing
It's easy to confuse them because both «simulate thousands of scenarios», but they attack different risks and complement each other:
It varies the SEQUENCE of your already-occurred trades. It answers «given that these trades exist, how sensitive is my result to their order and to missing some?». It's fast and runs on the trades of any backtest.
It goes deeper: it generates thousands of brand-new synthetic MARKETS (prices that never existed but are statistically similar) and re-runs the full algorithm on each. It answers «does this algorithm work in markets that are NOT exactly the history that trained it?». It's the hardest anti-overfitting filter, and it lives in «My Algorithms».
In practice: use Monte Carlo to size your risk (what drawdown should I be willing to take?) and Multiverse to decide if an algorithm deserves real money (does it generalize or did it just memorize the past?). The two together, plus Walk-Forward and DSR, are the four angles of robustness.