Live Trading
Trade and watch the market in real time: chart, symbol list and manual or automated orders, on any connected platform.
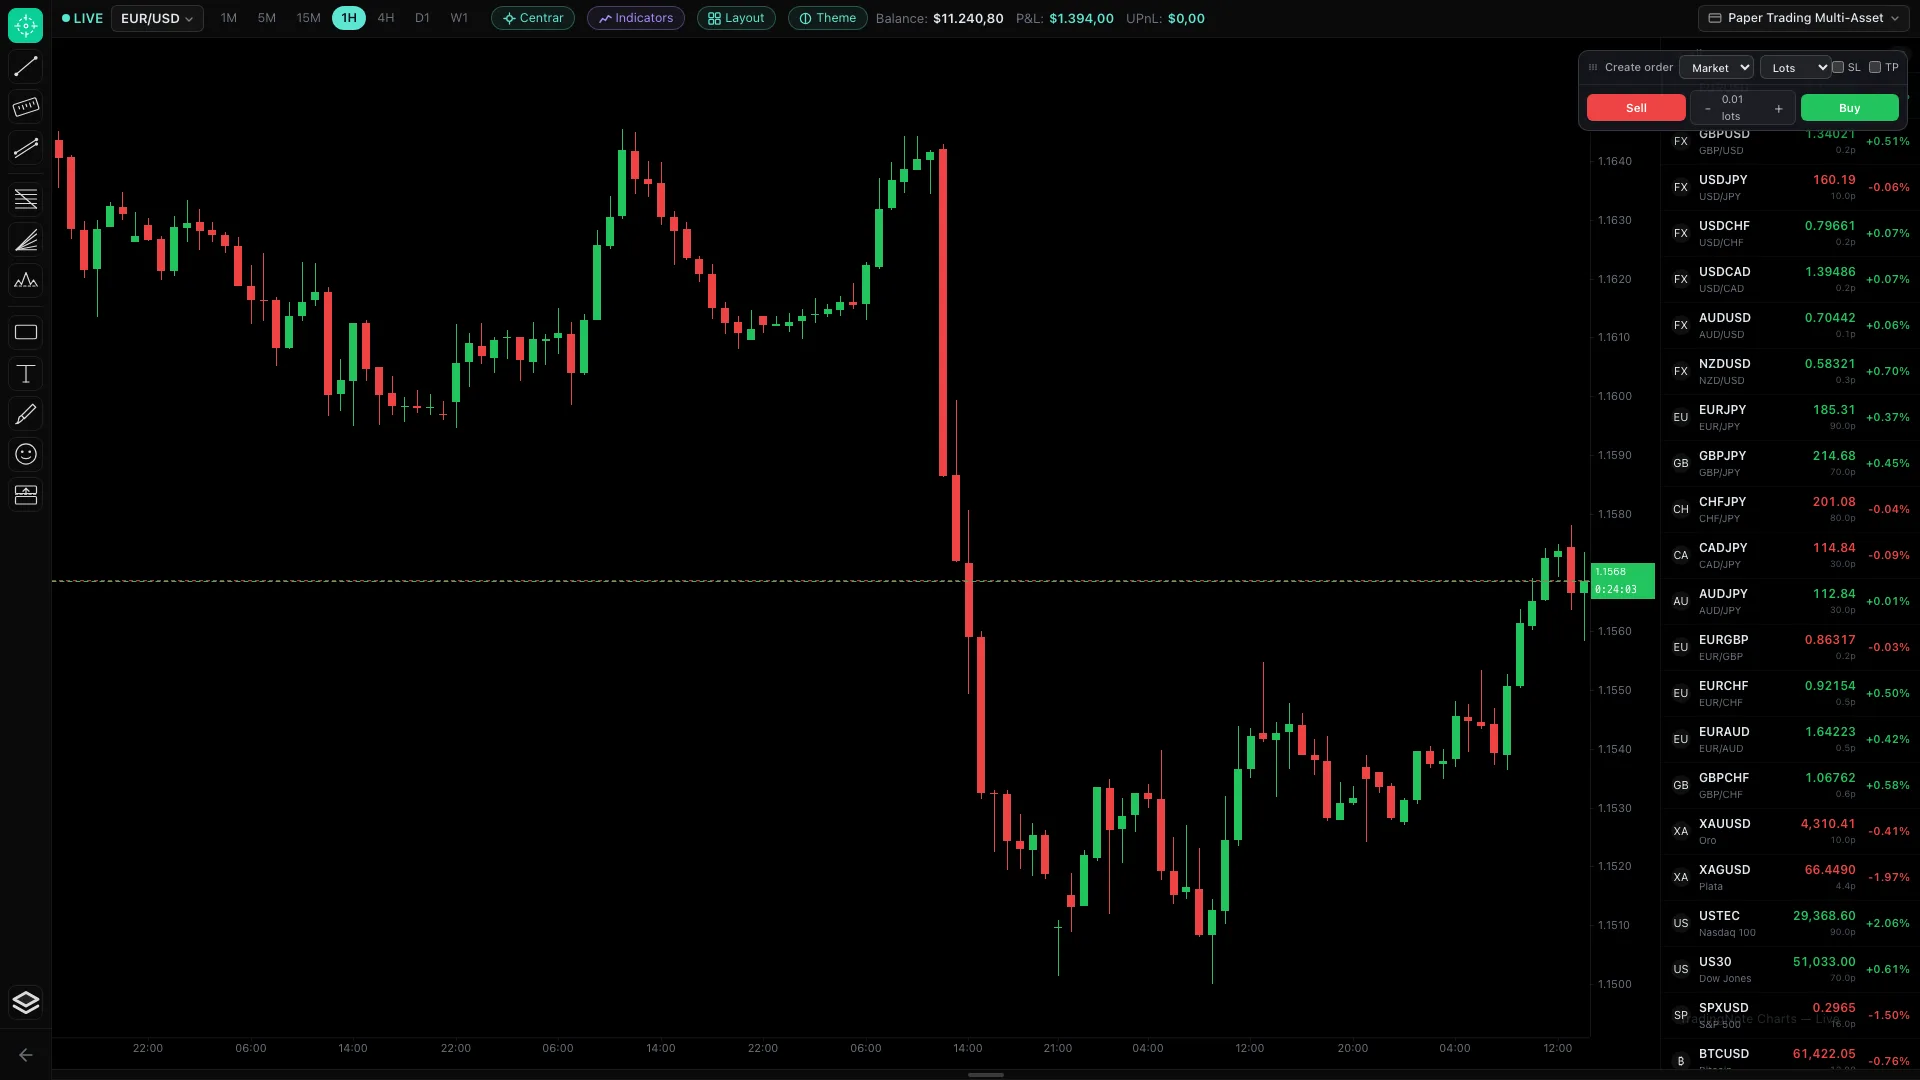
Live Trading is the screen to trade and monitor the market live. It opens in a new tab so you always have it handy while you browse the rest of TradingNote. It brings together three things: a real-time candlestick chart, a symbol list with prices, and a panel to send orders. But the most powerful part is underneath: each trade executes directly on your real platform (MT5, cTrader, TopstepX, NinjaTrader…) or on a practice account, without you ever leaving TradingNote.
Two ways to trade live
You decide each trade from the order panel: pick symbol, size, SL/TP and press Buy or Sell. Ideal for trading your own judgment, managing a position by hand or stepping in over what an algorithm is doing. The order travels to your real broker within seconds.
A portfolio of algorithms trades for you 24/7 without you being in front of the screen. Each algorithm watches its instrument, generates signals and executes with the institutional sizing you defined (risk budget by weight). You supervise; the machine executes. This is configured in Portfolios, not on this screen.
The screen areas
- Top bar: the active account (top right), the symbol and timeframe (1M, 5M, 15M, 1H, 4H, D1, W1), plus indicators, layout and theme.
- Left column: drawing tools (lines, rectangles, text, Fibonacci) to mark up the chart.
- Center: the live candlestick chart, with balance, P&L and floating P&L (UPnL) at the top.
- Right column: the order panel (Buy/Sell, lots, SL/TP) and the symbol list with price and daily change.
How to open a manual trade
- 1
Pick the account and symbol
Top right, select which account to trade with. Click a symbol in the right-hand list (EUR/USD, XAUUSD, etc.) to load it on the chart.
- 2
Set the size and limits
In the order panel type the lots (the size). Optionally set SL (Stop Loss, where you close if it loses) and TP (Take Profit, where you close if it wins).
- 3
Press Buy or Sell
Buy (green) if you think price will rise; Sell (red) if you think it will fall. The trade appears instantly and its floating profit/loss (UPnL) updates live.
Where the chart data comes from
When an algorithm trades live, the candles it uses to decide come from ITS own connection's data source: an MT5 account is fed by the MT5 bridge, a TopstepX one by TopstepX, a cTrader one by cTrader. So if an algorithm stops trading and you see «0 candles», it's almost always THAT platform's connection that went down (terminal off, broker with no data), not the whole platform.
Practice first with a Paper Trading account. You can open test buys and sells without risking real money and see exactly how the P&L behaves, with real market prices.
Floating P&L is always shown in US dollars (USD), even if the pair is quoted in another currency (USDJPY, USDCHF…). That way you compare all your trades in the same unit.