Two years of experience. In one week.
Don't wait months of a live account to know if your system works. Rewind the market and trade it candle by candle, at up to 100× speed, opening your trades as if they were real. At the end you see your stats calculated on your own execution — without risking a dollar.
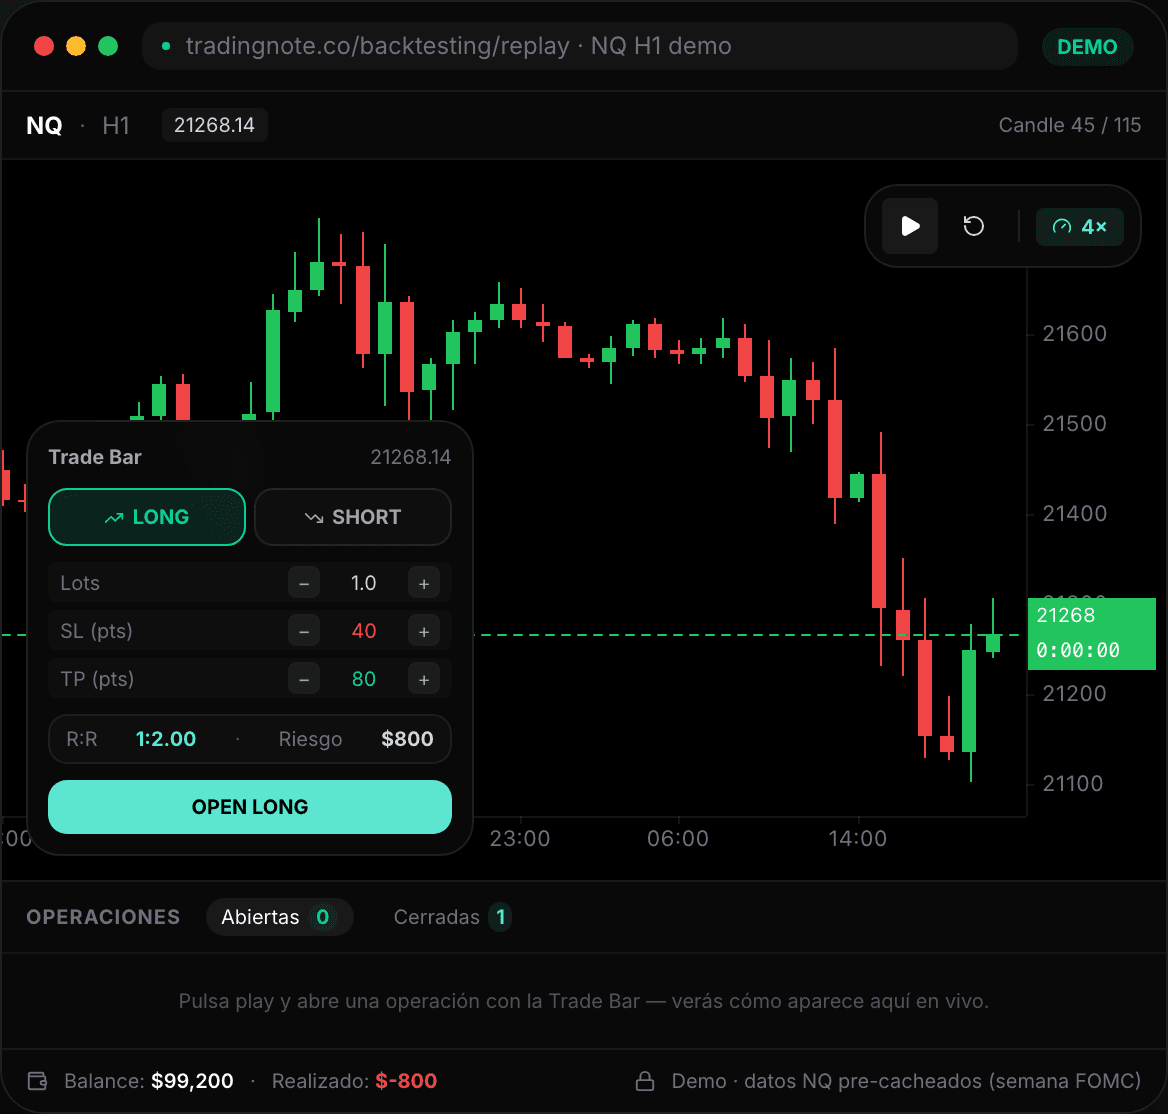
12 candles. One real decision.
A floating bar to open the trade, buy/stop loss/take profit markers on the chart, a panel with your open and closed trades, and replay at whatever speed you want. Hit play and play around — it's not a video, it's the real engine.
Data already loaded for NQ (Nasdaq 100 futures) during the week of the Fed meeting, Dec 8–12, 2025. Hit play, open trades and watch the stop loss and take profit trigger in real time. In the app you also get: 8 timeframes, indicators, draggable levels, limit or stop orders, and real commission and swap.
Replay with a real engine. Zero decorative GIFs.
Runs on the same engine as the automated backtest. Same metrics. So you can compare your manual execution against a bot, under the same rules.
Replay 1× to 100×
Adjust speed for the timeframe you want to practice. A week of M5 in 8 minutes. A month of H1 in 15. You're in control.
Floating trade bar
Buy or sell, in lots or in % risk, at market, limit or stop, plus stop loss and take profit. Levels you drag on the chart. One screen, without opening your broker's platform.
Several timeframes
Switch between M1, M5, M15, M30, H1, H4, D1 and W1 without losing your progress. Useful for validating entries that depend on what's happening on a higher timeframe.
Metrics identical to production
Sharpe López de Prado, Profit Factor, Expectancy, Max Drawdown, Win Rate, Recovery Factor — calculated with the same formula as live trading. No lying to the ego.
Import your MT5 history
Already traded demo or live and want to analyze it? Upload the HTML or CSV statement and get the full report without touching a single candle.
Real commission and swap
Final numbers include the cost of the broker you select. Your demo Sharpe isn't the same as your live Sharpe with $7 commission per lot — and here you see it first.
Four steps. From opening the app to having your real metrics.
Create the session
Pick instrument (EUR/USD, BTC, NQ, whatever), date range, starting balance. The session is saved — pause and resume whenever.
Replay bar by bar
Hit play. The engine replays the market at your chosen speed. When you see a setup, open the trade from the Trade Bar. SL and TP set in one move. Advance, observe, decide.
Close whenever
Click the open trade → Close. Or let SL/TP do it for you. The session saves every decision with timestamp and exact price. Balance updates live.
Read your statistical report
At the end (or anytime) open the report with every metric: equity curve, drawdown, Sharpe, Profit Factor, return distribution, max streak, expectancy per setup.
What this actually solves
If this sounds like "just a simulator" to you, you haven't used one properly. This is the lever that compresses your learning curve — without burning capital learning what you could have already known.
Validate a new setup in hours
Before committing capital to an idea, test it on 200 past trades. If your Profit Factor comes out below 1.3, you already know it wasn't gold.
Practice prop firm evaluation
Set balance $50K, daily loss 3%, drawdown 8% and trade the session like it's real. If you pass, buy the challenge; if not, keep practicing free.
Compress your learning curve
A trader takes 2 years to make 500 real trades. Here you do them in a week. More feedback, faster — without paying for it with your account.
Audit your past trading
Upload the HTML statement of your last 6 months trading live. Without touching anything by hand, you see where your PF falls apart, which setup bleeds your account and which session pays.
Compare two systems
Session A with your classic system, session B with the new variant. Same market, same dates. The report tells you which delivers better risk-adjusted Expectancy.
Kill the stage fright
If your system works in manual backtest, the next step is live demo. Then real. No leaps of faith — scaling with data.
Your sessions. Your history. Your evolution.
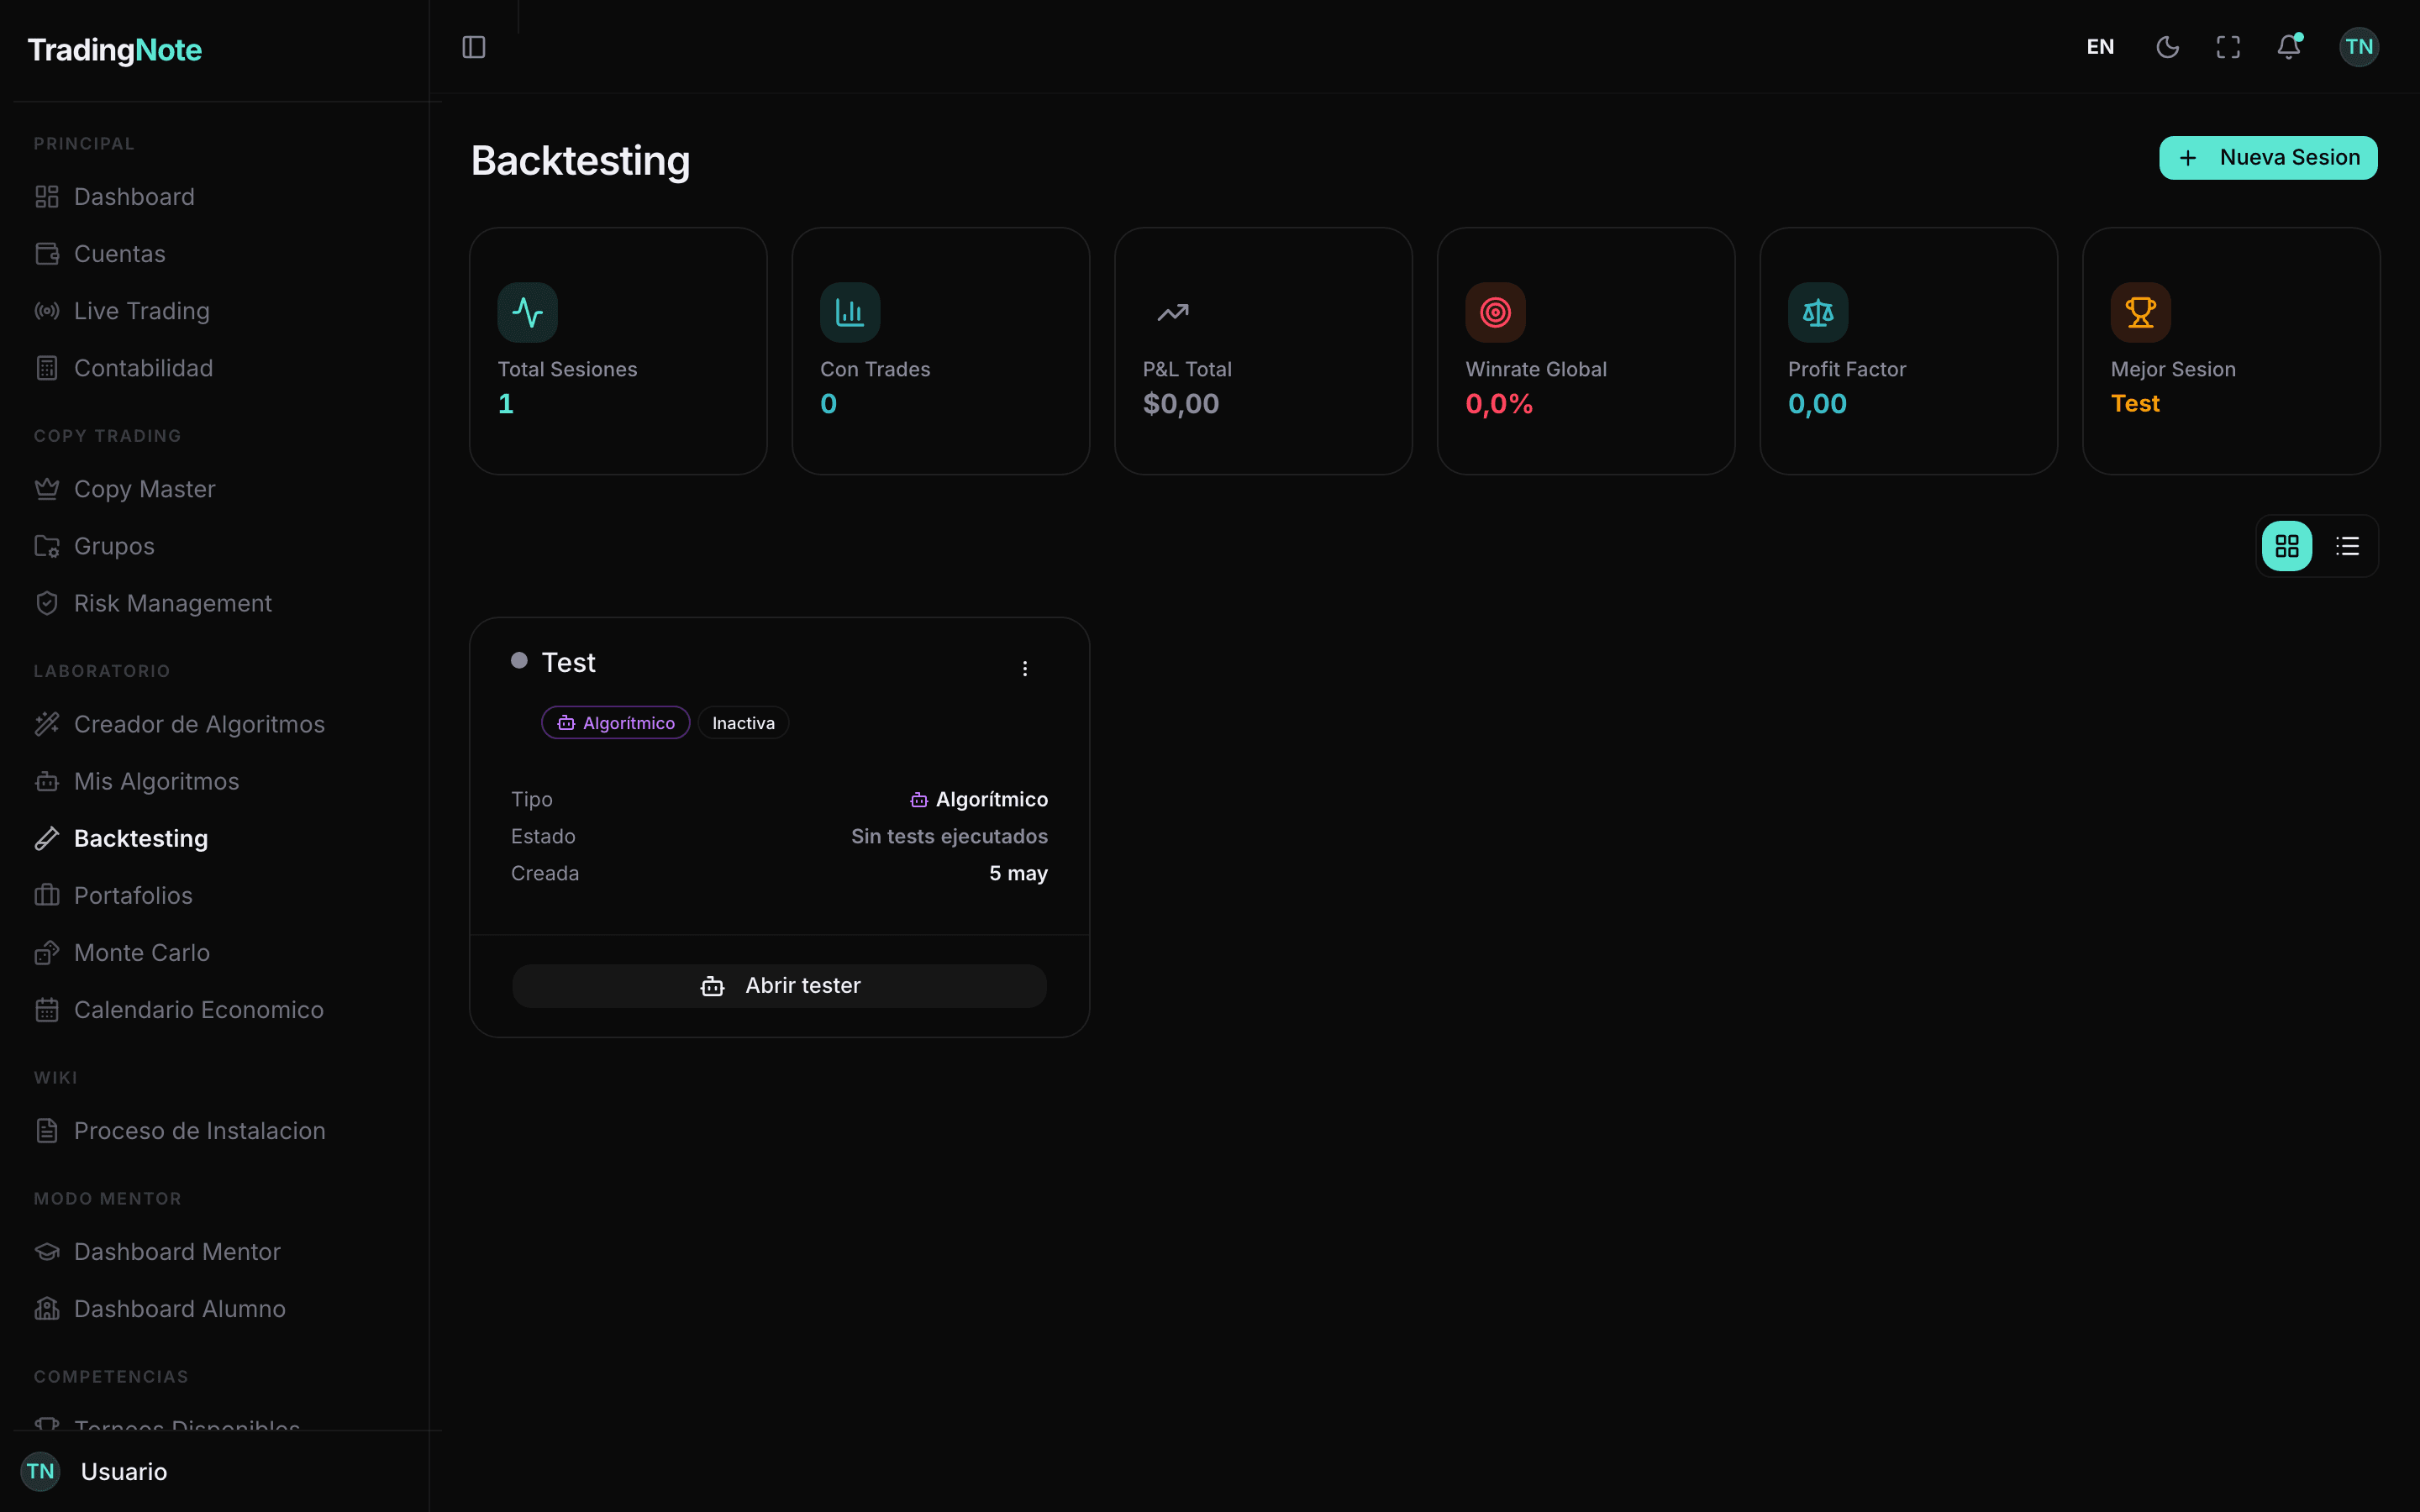
Every saved session is ready to continue. Switch instrument, close it, come back tomorrow. The state persists — open trades, exact candle where you left off, everything.
Frequently asked questions
A simulator that replays the historical market bar by bar: you step time forward, open and close trades and see your result as if it were real — without risking money.
No. The replay is 100% visual: you pick symbol, timeframe and date, and trade with the mouse. Coding is only needed to automate, and even then you can build bots with no code.
Yes. It replays real historical data from our market server, with candles from M1 upward, so the practice is faithful to what actually happened.
You trade the replay yourself, by hand, to train execution and discipline. Automated backtesting runs a strategy over years of data in seconds and measures whether your edge is real with statistics (Walk-Forward, Monte Carlo).
The distance between your setup and your live account is crossed by practicing.
FREE plan includes manual backtest with limited sessions. For unlimited and heavy multi-timeframe, PRO plan ($49).
Start free