Dashboard
Your home screen: how you're doing, at a glance, with all your accounts in one place.
The Dashboard is the first thing you see when you enter TradingNote. It gathers the state of all your activity on a single screen so you know «how am I doing» without opening each account one by one. If you've never used a platform like this, think of the Dashboard as a car's dashboard: at a glance you see speed, fuel and warnings.
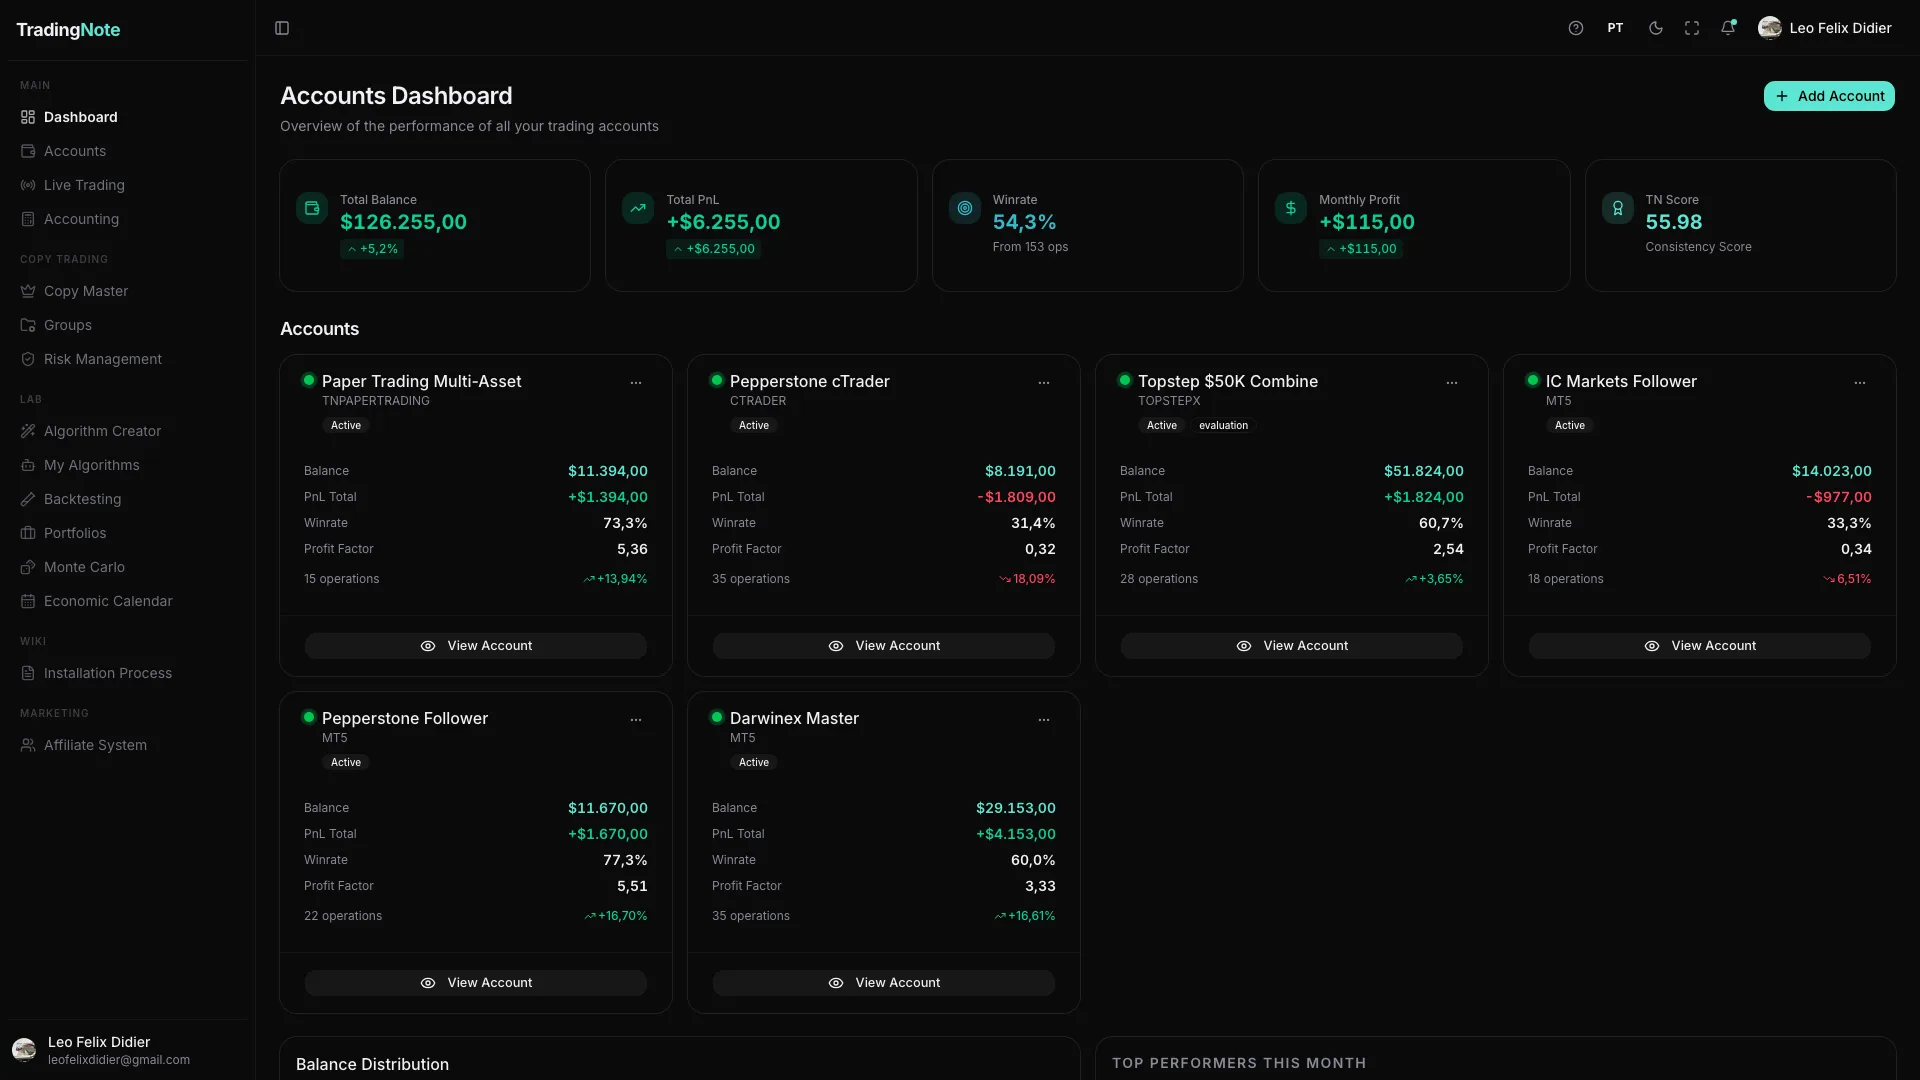
What each number means
At the top you'll see four large indicators that summarize your entire account portfolio:
- Total Balance: the sum of money across all your connected accounts.
- Total P&L (Profit/Loss): how much you've gained or lost overall. Green = profit, red = loss.
- Win Rate: the percentage of trades that closed in profit.
- Active Accounts: how many of your accounts are connected and trading.
The account cards
Below the indicators there's one card per account. Each card shows the broker, balance, total P&L, winrate, profit factor and number of trades. The green dot next to the name means the account is active and syncing.
Click «View Account» on any card to open that account's full detail: its trades, equity curve and health.
Is your Dashboard nearly empty? That's normal if you just signed up: you haven't connected any account yet. Go to the Accounts section to connect your first broker and the numbers will start filling in.
The activity calendar
The Dashboard also includes a calendar that colors each day by your result: green if you won, red if you lost, and more intense the larger the amount. At a glance you spot patterns that loose numbers hide: do you always lose on Mondays? are your best days the high-volatility ones? That heatmap is one of the most powerful self-awareness tools for a trader.
Use the Dashboard as a daily routine: open it at the start to see your overall state and at the end to log how the day went. Over time, the activity calendar will tell you more about your trading than any chart indicator.